Technical Notes
The Penn State Particle Separator: What It Actually Tells You
Four boxes and a set of scales give you a fast, honest picture of your TMR's physical form. They are also easy to misread. Here is how to run it properly and what the numbers can and can't tell you.
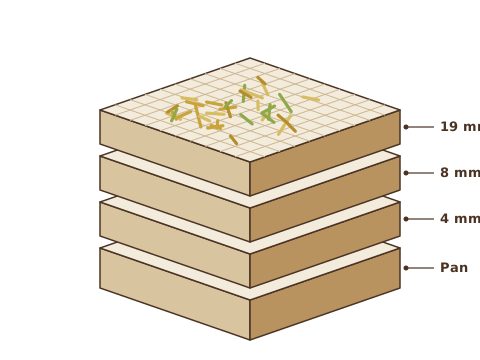
The Penn State Particle Separator (PSPS) is the most widely used on-farm tool for checking forage and TMR particle size. The current version uses three sieves and a bottom pan: 19 mm, 8 mm, 4 mm and the pan. An older set included a 1.18 mm screen, which was used mainly to estimate physically effective NDF, so older reports may not match newer ones.
Running it correctly
- Sample representatively. Take handfuls from several points along the bunk right after feed delivery, mix them, and use about 1.4 L of material.
- Shake on a flat surface. Shake 5 times in one direction, rotate the stack a quarter turn, and repeat for 8 sets, giving 40 shakes in total. Each stroke should be about 17 cm, at roughly one shake per second.
- Weigh each fraction and express it as a percentage of the total, on an as-fed basis.
- Repeat. Run at least two samples per ration. A single shake is an anecdote, not a measurement.
General target ranges
| Screen | TMR | Corn silage | Haylage |
|---|---|---|---|
| Upper · 19 mm | 2–8% | 3–8% | 10–20% |
| Middle · 8 mm | 30–50% | 45–65% | 45–75% |
| Lower · 4 mm | 10–20% | 20–30% | 20–30% |
| Pan | 30–40% | < 10% | < 10% |
Penn State Extension guidelines (Heinrichs, 2013). Treat them as starting points, not pass/fail limits.
What it does tell you
- Physical form and chewing potential. Material retained on the 8 mm and 4 mm screens is roughly what stimulates rumination. Multiplying the fraction above 4 mm (or 8 mm) by ration NDF gives a practical estimate of physically effective NDF (peNDF).
- Sorting risk. A large top-screen fraction of long, dry material is the most common trigger for sorting.
- Sorting that has actually happened. Compare fresh TMR with the feed a few hours later and with refusals. If the upper screens climb over the day, cows are sorting against long particles.
- Consistency. Repeated measurements show changes in chop length, mixer wear or overmixing over time.
What it doesn't tell you
- Chemistry. Two TMRs with identical screen results can differ widely in NDF, NDF digestibility and starch.
- Kernel processing. Broken kernels hide among the 4 mm and pan fractions. Use a kernel processing score for that.
- Whether cows eat the ration as mixed. Only sampling across the day and sampling refusals shows that.
A quick interpretation routine
- Is the top screen above about 10%? Check whether long hay or straw is being sorted, and consider processing it shorter.
- Is the middle + lower fraction reasonable? Together they are the backbone of effective fiber.
- Is the pan high? Read it together with starch level and fermentability, and with rumination and manure.
- Does the distribution change through the day? If yes, the problem is management, not formulation.
The separator is a screening tool. It works best when you read it next to the cows: rumination, manure consistency and refusals give the numbers meaning.
Key takeaways
- Current PSPS: 19 / 8 / 4 mm plus pan. Check which version a report used.
- Follow the 40-shake protocol and run duplicate samples.
- Particle size shows physical form and sorting, not nutrient content.
- The comparison between fresh TMR and refusals often tells you more than any single target range.
Selected references
- Heinrichs, J. (2013). The Penn State Particle Separator. Penn State Extension, DSE 2013-186.
- Kononoff, P.J., Heinrichs, A.J. & Buckmaster, D.R. (2003). Modification of the Penn State forage and total mixed ration particle separator and the effects of moisture content on its measurements. J. Dairy Sci. 86:1858–1863.
- Leonardi, C. & Armentano, L.E. (2003). Effect of quantity, quality, and length of alfalfa hay on selective consumption by dairy cows. J. Dairy Sci. 86:557–564.
Educational content. It does not replace individualized veterinary or nutrition consultation.